
Every kilowatt-hour,
accounted for.
Independent measurement and verification that turns energy-savings claims into auditable, bankable results, for cooling plants, chilled-water networks and energy performance contracts.
Savings can’t be metered directly. They have to be proven.
A saving is energy that was never used. The only way to know it is real is to compare what was used against what would have been used, under the same conditions.
Without M&V
- Savings are estimates nobody can check
- Performance drifts and nobody notices
- Contract results end in disagreement
- The next investment is hard to justify
With M&V
- Savings are measured and verified
- Problems like low ΔT are caught early
- Every party agrees on the results
- Evidence that funds the next project
Malaysia’s Energy Efficiency and Conservation Act 2024 brings energy reporting and audits for large energy users. Verified data makes compliance straightforward.
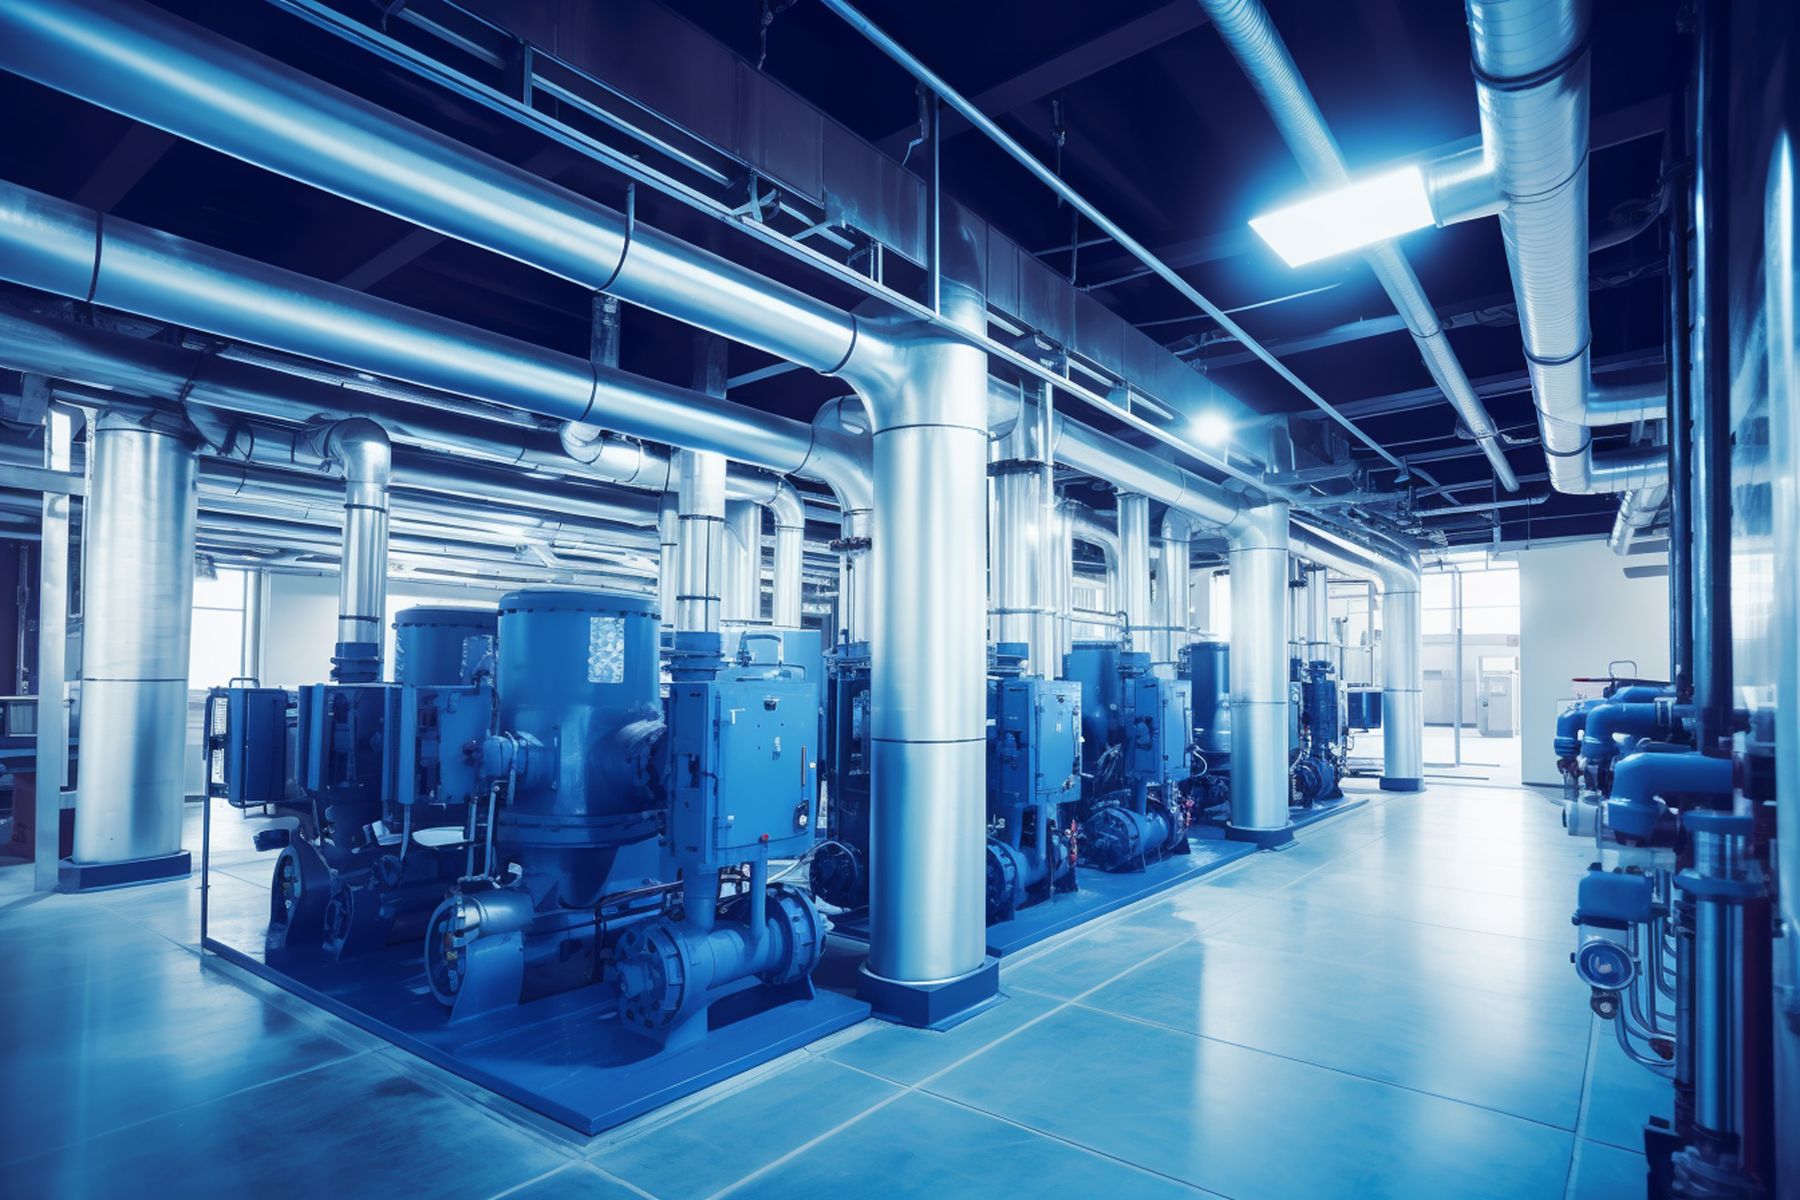 Confidential client · District cooling
Trusted by one of Malaysia’s most established district cooling plants.
AD Energy has carried out measurement and verification for a long-established district cooling plant that supplies chilled water to landmark developments in Malaysia, giving its operator an independent, evidence-based view of how the plant really performs.
- Measurement & verification of plant performance
- Metering and data review
- Performance baseline
- Verification reporting
Client name and project details are withheld under confidentiality. References are available on request, subject to client consent.
One equation. Zero ambiguity.
Adjustments bring both periods to the same conditions, so savings reflect real performance, not a cooler month or a quieter quarter.
Adjusted baseline vs measured energy
Monthly cooling-plant electricity, MWh · illustrative example
View as table
| Month | Baseline (MWh) | Measured (MWh) | Savings (MWh) |
|---|---|---|---|
| Jan | 1,980 | 1,700 | 280 |
| Feb | 1,890 | 1,610 | 280 |
| Mar | 2,060 | 1,730 | 330 |
| Apr | 2,110 | 1,750 | 360 |
| May | 2,150 | 1,780 | 370 |
| Jun | 2,090 | 1,760 | 330 |
| Jul | 2,070 | 1,720 | 350 |
| Aug | 2,080 | 1,710 | 370 |
| Sep | 2,040 | 1,690 | 350 |
| Oct | 2,010 | 1,690 | 320 |
| Nov | 1,960 | 1,670 | 290 |
| Dec | 1,940 | 1,630 | 310 |
| Total | 24,380 | 20,440 | 3,940 |
The right method for every measure.
The International Performance Measurement and Verification Protocol defines four options. We select and tailor the approach that gives the required confidence at the right cost.
Key parameter measurement
The key performance parameter of the improvement, such as power draw, is measured at the equipment boundary, while secondary parameters like operating hours are reliably estimated.
All-parameter measurement
Every parameter that affects energy use is measured continuously at the boundary of the retrofit, capturing true performance as load and conditions change.
Whole-facility measurement
Savings are determined from whole-plant or whole-facility metering, using regression models that normalise for weather, cooling demand and other independent variables.
Calibrated simulation
Energy use is modelled with simulation calibrated against measured data, ideal where no baseline exists, or where measures interact in complex ways.
Instrumented down to every pump.
Calibrated meters and sensors across the plant and network capture the parameters that define cooling performance, continuously, not just on audit day.
Plant efficiency
Electrical input per refrigeration ton, the headline measure of plant performance.
Chilled water ΔT
Supply and return temperature difference that reveals low ΔT syndrome.
Cooling energy
Thermal energy delivered to the network, measured with calibrated BTU meters.
Flow
Primary and secondary flow rates that drive pumping energy.
Electrical energy
Chillers, pumps and cooling towers metered individually.
Supply temperature
Chilled water and condenser water temperatures, continuously logged.
Storage performance
Charge and discharge capacity and thermocline integrity over time.
Uncertainty
Statistical confidence in every reported savings figure.
From M&V plan to verified result.
A disciplined, documented process that stands up to scrutiny from owners, auditors and financiers alike.
Plan
Define the measurement boundary, IPMVP option, metering points and reporting schedule in a formal M&V plan.
Baseline
Collect pre-improvement data and build a statistically validated baseline model against weather and load.
Measure
Install, calibrate and continuously log meters and sensors throughout the reporting period.
Verify & report
Apply adjustments, quantify uncertainty and issue savings reports with a complete audit trail.
Confidence for everyone with a stake in performance.
Plant owners & operators
Know exactly how your district cooling plant performs, month after month.
Energy service companies
Independent verification that backs performance guarantees and contracts.
Building & campus owners
Confirm that efficiency upgrades deliver the return you invested in.
Investors & lenders
Transparent, defensible savings data that makes efficiency bankable.
Documented to an auditable standard.
Every engagement produces a complete, traceable record, from the first meter specification to the final verified savings figure.
- M&V plan aligned with IPMVP
- Metering and instrumentation specification
- Sensor calibration records
- Baseline model and baseline report
- Routine and non-routine adjustment log
- Periodic savings reports
- Live performance dashboard
- Annual verification report
Built on recognised standards.
International Performance Measurement and Verification Protocol, the global framework for determining savings.
Measurement of energy, demand and water savings, including statistical criteria for baseline models.
Measurement and verification of the energy performance of organisations.
Energy baselines and energy performance indicators.
Let’s unlock your next efficiency gain.
Share your plant, network or building challenge. Our team will respond within one business day.